Change Implementation Techniques for Creating a Sense of Urgency
Technique 2.14 Diagnosing Your Business
Introduction
. Under the 4 headings or principles (your competitive position determines your options, customers and profit don't standstill, simplicity gets results, and cost and prices almost always decline), answer the questions below.
. A lot of accurate and readily available data needs to be available to use with the analytical tools that are part of these 4 headings
. This involves a holistic approach to diagnosing your organisation. For example, it is of limited value simplifying your processes without looking at other aspects of the organisation, such as decision-making, customers, culture, etc. Furthermore as diagnostic approach is only part of performance improvement, you need to decide where your organisation wants to be in the future and focus on 3 to 5 critical initiatives that will get you there.
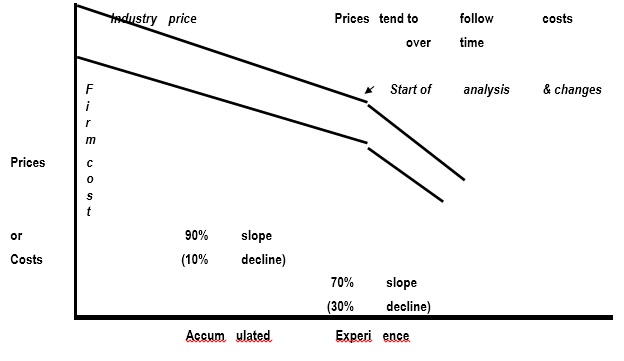
. Using the experience curve ‐ a graph showing the decline in an organisation's costs or prices as a function of accumulated experience (total units produced or services delivered) has doubled. For example, a 70% slope means that prices have dropped by 30%. Mapping your industry price curve against your own costs curve can help pinpoint cost-reduction objectives, ie
Experience Curve
. Some examples of price slope and decline for different industries (USA)
|
Industry |
Dates of studies |
Price slope (%) |
Price decline (%) |
|
Microprocessors |
1980 - 2005 |
60 |
40 |
|
LCDs |
1997 ‐ 2003 |
60 |
40 |
|
Brokerages |
1990 ‐ 2003 |
64 |
36 |
|
Wireless services |
1991 ‐ 1995 |
66 |
34 |
|
Butter |
1970 ‐ 2005 |
68 |
32 |
|
VCRs |
1993 ‐ 2004 |
71 |
29 |
|
Airlines |
1988 ‐ 2003 |
75 |
25 |
|
Crushed stone |
1940 ‐ 2004 |
75 |
25 |
|
Mobile phone services |
1994 ‐ 2000 |
76 |
24 |
|
Personal computers |
1988 ‐ 2004 |
77 |
23 |
|
DVD players/recorders |
1997 ‐ 2005 |
78 |
22 |
|
Cable set-top boxes |
1998 ‐ 2003 |
80 |
20 |
|
Cars |
1968 - 2004 |
81 |
19 |
|
Milk bottles |
1990 ‐ 2004 |
81 |
19 |
|
Plastics |
1987 ‐ 2004 |
81 |
19 |
|
Colour TVs |
1965 ‐ 2005 |
83 |
17 |
|
DVDs |
1997 ‐ 2002 |
85 |
15 |
. The relationship between process and cost in any given activity will determine some of the priorities. For example, if industry prices are going down but your costs are going up or holding steady, cost improvements are likely to be your most urgent challenge. Your costs will need to decrease over the long-term regardless of what prices are doing. An upward movement in prices is frequently only temporary. In addition to understanding your overall cost trends, you need to examine every segment of costs to determine where the challenges and opportunities occur, such as manufacturing, supply chain, service operations, overheads, etc. You need to identify the key cost components and trends in each activity, even if the activity appears to be doing well.
. You need to determine costs relative to your competitors' costs, ie
"...analysis of costs position quantifies cost differences between your business and your competitors'; it also shows which cost elements and specific practices are different. Drill down until you understand where and how you differ, and why...will help you figure out where you can close costs gaps and gain or regain competitive advantage. It will also help you formulate detailed plans to do so..."
Mark Gottfredson et al, 2008
. Understanding your cost position and experience curve enables you to set profit targets. For example, your lower-cost competitors are on their own experience curves and will have improved their own positions by the time you reach their current cost levels. This kind of analysis presents an opportunity as you construct a hypothetical competitor who represents the best demonstrated practices of all your competitors in one. This means this hypothetical competitor has the lowest costs and best performance to provide a benchmark.
. Next step is to assess the profitability of your product/service lines. The aim is to calculate the true margins of your products or services by using activity-based costing, ie determine direct costs for each product/service based on actual activities performed, rather than using standard costings. Then accurately allocate indirect costs to each product line and customer segment. This should reveal the key cost and revenue drivers you need to address.
. For example, a CEO asked the following questions of his heads of business units
"...to delineate their expectations of operating profit during the coming year and to explain the expected changes from the preceding year. Then he asked for more details. One question was What percentage of your revenue represents sales to customers you would consider to have significantly leverage over them? Another was how much of your revenue do you believe represents price-sensitive, commodity type products? Other questions focus on the cost side, including matters such as purchasing procedures and performance compared with that of rivals ... subsequently made major shifts in product lines to deemphasize commodity products and unprofitable customers..."
Mark Gottfredson et al, 2008
Heading 1 (Cost and prices almost always decline)
Questions on Heading 1 (Cost and prices almost always decline)
. How does your cost slope compare with your competitors?
. What is the slope of price change in your industry right now, and how does your organisation's cost curve compare?
. What are your costs compared with your competitors?
. Who is the most efficient and effective in priority areas?
. Where can you improve most, relative to others?
. Which products or services are making money (or not) and why?
Heading 2 (Your competitive position determines your options)
Introduction
. This uses the concept of relative market share (RMS). It is calculated by dividing your market share by the closest competitor or market leader. To assess your position in the marketplace plot your competitors and your organisation's RMS against its return on assets (ROA). Generally organisations in well-defined industries line-up and follow a fairly narrow band. Most market leaders out-perform followers on ROA. On the other hand, some organisations are above band returns while having mid-range or low market share; others languish below the band with low ROA owing to not managing their costs. Generally, the higher RMS, higher the ROA; and vice versa, ie market leaders tend to out-perform market followers on ROA as they have great accumulative experience, leading to lower costs and superior custom insights; thus greater profits with the ability to out-invest the competitor in innovation, customer service, branding and product/service support.
. When comparing your organisation's returns and market share with competitors, the ROA/RMS chart is very useful, ie
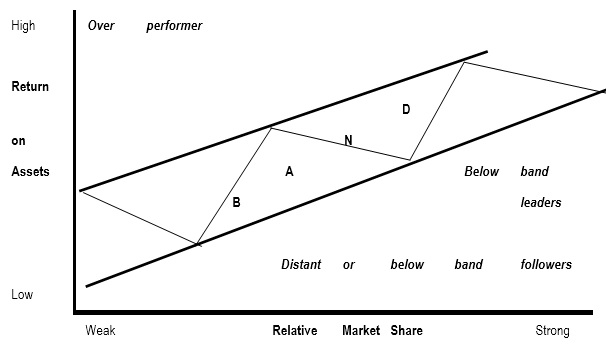
There are 5 generic positions on this chart (in-band leaders, in-band followers, distance or below-band followers, below band leaders and over-performers). Each position has its own imperatives, ie
"...in-band leaders find that they can raise the bar for competitors by investing in still-greater market share and in product or service improvements. In-band followers usually need to work hard just to keep up; only occasionally can they jump into a leadership role through heavy investment in innovation ... Over-performers, which earn returns well beyond what their relative market share should suggest, typically need to maintain high-level investment in whatever has enabled them to escape the pull of the band ... might be a trusted or prestigious brand, an innovative or patented technology, exceptional loyalty ... below-band companies ... have probably not been managing their costs down the experience curve, which would be a primary reason for their underperformance..."
Mark Gottfredson et al, 2008
Furthermore,
"...Band analysis can be used for the two other diagnostic tasks: anticipating competitors' improvement strategies and assessing businesses in multi-unit organisations..."
Mark Gottfredson et al, 2008
. Mapping your organisation against competitors is an important first step in determining how profitable you are. Furthermore, it helps spots potential threats and opportunities, and the strategic options available. For example, with credit cards it was found that there is no relationship between market share and returns; customer loyalty was found to be the single most important factor in determining profitability. Therefore measures to increase customer loyalty, such as reward programs, are very important. Furthermore,
"...band analysis can also help the leader of multi-unit or organisation determine which business is achieving close to its full-potential performance..."
Mark Gottfredson et al, 2008
. Measure your market size and trends by drawing a rectangle and then dividing it into vertical segments representing your most important submarkets for all products; with the width of the segments indicating the share of the revenue. Then divide each of the vertical segments into boxes representing the share held by competitors. Create one chart for the last 3 to 5 years; another for the current situation. The 2 charts will then show you the sectors and the competitors experiencing market growth. Remember: as fast-growing markets attract more competitive interest, a more aggressive plan is needed to win market share and improve profitability. An alternative tool is the S-curve.
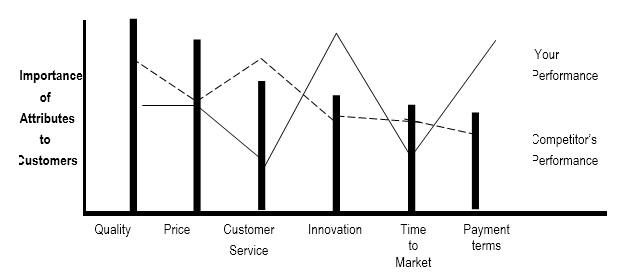
The Segment Needs and Performance Chart
The bar chart represents the customer's perception of the industry plus your organisation and one competitor.
. Assessing your firm's capabilities may lead to an assessment that you need to develop capabilities that you don't currently possess. For example, to sell the Ipod, Apple had to develop abilities to manage and sell digitized music through its iTune stores. Furthermore, decisions about what capabilities you want to outsource, etc need to be made.
Remember:
"...the primary basis of competition has shifted from ownership of assets (stores, factories, and so on) to ownership of intangibles (expertise in supply chain or brand management, for example). At the same time, a handful of vanguard companies have transformed what used to be purely internal corporate functions into entirely new industries. Thus FedEx and UPS operate our world-class logistic-management services, while Wipro and IBM operate numerous business and ID services.
The result of all this is that companies can no longer afford to make sourcing decisions on a piecemeal basis ‐ nor can they be satisfied with a "good enough" approach to selecting and working with suppliers. Today, you must assess every capability that you need in order to create or develop a product or service. You should analyse every step of the value chain, from design and engineering to product or service delivery. You compare yourself with competitors in your industry at every step of the chain but also with whatever companies are the best in the world and performing each particular step..."
Mark Gottfredson et al, 2008
Questions on Heading 2 (Your competitive position determines your options)
. How do you and your competitors compare in terms of returns on assets and relative market share?
. How are the leaders making money, and what is their approach?
. What is the full potential of your business position?
. How big is your market?
. What parts of your market are growing fastest?
. Where are you gaining or losing market share?
. What capabilities are creating a competitive advantage for you?
. Which ones need to be strengthened or acquired?
Heading 3 (Customers and profit don't stand still)
Introduction
. As customers needs and desires are continually changing, tactics that worked well yesterday are not necessarily suitable for today or tomorrow. You need to study customers' needs and their behaviours by segment so that you build customer loyalty, increase growth, gain market share and expand your share of the profit pool. You need to look at customers from many different perspectives. One such way is SNAP (see previous chart) which can be used to help identify the importance of attributes of your products or services as seen by the customer.
. You need to track customer retention and loyalty. Loyalty is critical when the cost of acquiring any new customers is high. A good way to do this is the Nett Promoter Score (NPS). This measures customers' response to the question "How likely is in that you would recommend this company/product/service to a friend or colleague?" Respondents answer on a scale from 0 to 10; with 10 meaning "extremely likely" and 0 means "not at all likely". NPS is the percentage of promoters (scores of above 6) minus the percentage of detractors (scores below 6). The NPS is shown to be correlated with growth rates and other measures of customer satisfaction.
Furthermore,
"...segmentation and retention efforts are at the opposite ends of the six-step chain of activity that enables the company to earn more profits per customer than its competitors and then to out invest the competitors to generate faster growth. The first steps are i) identify the most attractive target segments and ii) designing the best value propositions to meet their needs. The next ones iii) acquiring more customers in the target segments and iv) delivering a superior customer experience. That enables the company v) to grow its share......and vi) to increased loyalty and retention, with more promoters and fewer distractors..."
Mark Gottfredson et al, 2008
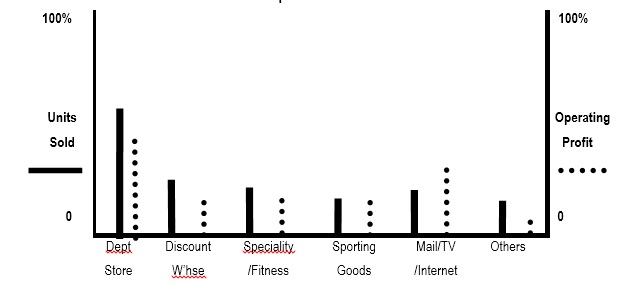
. Need to anticipate profit-pool shifts. Organisations need to know what percentage of the industry profit pool they currently have and what it will be in the future, ie what are likely to change and create opportunities or threats? Using a profit pool map (see below) will show the channels, products/services or sequential value chain activities and indicate the total profits available from them. You can compare your business and competitors' share of profit. This involves gathering
"...extensive data about customers intention to purchase or repurchase and develop profit-pool projections by product......by sales channel......and......price point (entry-level, value and premium)..."
Mark Gottfredson et al, 2008
It is best to compare 2 points in time so that you can identify how the profit pool is evolving.
Remember: significant potential significant threats can come from organisations that are not already competing in your industry and/or are still too small to be noticed.
A Map of the Profit Pool
Questions on Heading 3 (Customers and profit don't stand still)
. Which are the biggest, fastest-growing, and most profitable customer segments?
. How well do you know customers' needs relative to competitors and substitutes?
. How are customers segmented, ie on the basis of needs, behaviour, use demographics?
. What are each customer segment's characteristics and spending habits?
. What proportion of customers are you retaining, ie retention rates?
. What share of each segment's "dollar" are you getting, and is this a reason to think that you can increase that share?
. How is the profit pool likely to change in the future?
Heading 4 (Simplicity gets results)
Introduction
. The more complex an organisation is, the less profitable it is. It has been found that complexity raises organisational costs and hinders growth. For example,
"...researchers found that the least complex companies grew 30% to 50% faster than companies with average levels of complexity, and 80 % to 100% faster than the most complex companies..."
Mark Gottfredson et al, 2008
. Benchmarking your products or services against your competitors can help you identify the point at which the variety of products or services offered can maximize your sales and profits. Tools such as the Model T Analysis are helpful. Furthermore,
"...if you know what your customer wants now and what they are likely to want in the future, you can better judge what variety is appropriate for your marketplace..."
Mark Gottfredson et al, 2008
The Model T Analysis is a way to discover where your innovation fulcrum is. First you determine the process cost of selling an absolute minimum number of standard products, like Henry Ford's one-size-fits-all 1920s Model T. Then you add variety back into the business, product by product or service by service, and carefully forecast the resulting impact on customer sales and costs across the value chain (include operations, marketing, supply chain management, etc). You need to choose a configuration that is average in terms of content, cost and cycle time throughout the system. When the analysis shows the costs beginning to overwhelm the annual revenues, this is your innovation fulcrum. Sometimes organisations have more than 1 base product/service, eg
- entirely different customer segments
- separate manufacturing processes
- reliance on different platforms so that the supply chain cannot be compared.
Testing for complexity is a necessary counterbalance to customer segmentation. The latter keeps dividing your customers into finer subcategories so that products can be tailored to specific needs. This can be over-done and reduce profitability.
Sometimes it is hard to isolate specific costs for producing a particular product or service. A way of handling this is to investigate a smaller competitor that operates with a much more basic set of offerings and compare their performance. Another way is to look outside your immediate industry to gain insight into your base-line.
Once you have established the cost of producing the basic product, start developing options that will be valued by the customer, ie
"...by expanding the product line, item by item, a company can forecast costs that greater complexity will add as well as incremental revenue that will be gained. Using detailed market research and customer analysis, managers can determine, in concrete terms, the level of choice customers demand ... adding only a single element of complexity at a time and then tracing the effect through the value chain..."
Mark Gottfredson et al, 2005
Add complexity only when customers want it and are willing to pay more than the actual costs of the additions.
Model T Analysis

Usually marketing staff want more product diversity, while operational staff want less.
. A similar exercise can be done on your decision-making procedures, processes, etc. For decision-making process a tool called Rapid Analysis (recommend, agree, give input, decide, perform or implement the decision) is useful. Another useful tool is spans-and-layers analysis, which shows the number of levels in an organisations from the CEO to the front line worker, and the number people reporting to each level. If too few people are reporting to an individual boss, excess overhead charges, slow decision-making and unnecessary managerial oversight may be the consequence.
When evaluating your company's decision-making, seek feedback from all stakeholders including employees, suppliers, distributors and customers.
For processes, use process mapping as a tool to identify the different steps in the processes, areas for improvement, how important the step is, the time it takes to complete a step, what would happen if a step was eliminated, etc. Successful streamlining of the processes can
"...increases efficiency, allowing a company to reduce head count and its costs. Streamlining also cuts down on errors and rework. It reduces cycle time, enabling the company to deliver the product or service to the customer significantly faster and enhancing customer loyalty. More loyal customers are likely to order more, generating growth and increasing the possibility of still greater profit..."
Mark Gottfredson et al, 2008
Questions (Simplicity gets results)
. How complex are your product or service offerings, and what is a degree of complexity costing you?
. What would your organisation looked like if it made and sold only a single product or service?
. Where is your product or service innovation fulcrum?
. What are a few critical ways your product or service stand outs in the customers' minds?
. Have complex is your decision-making and organisation relative to your competitor?
. What is the impact of this complexity?
. How does complexity reside in your processes?
. What is it costing you?
(sources: Mark Gottfredson et al, 2008; Mark Gottfredson et al, 2005)